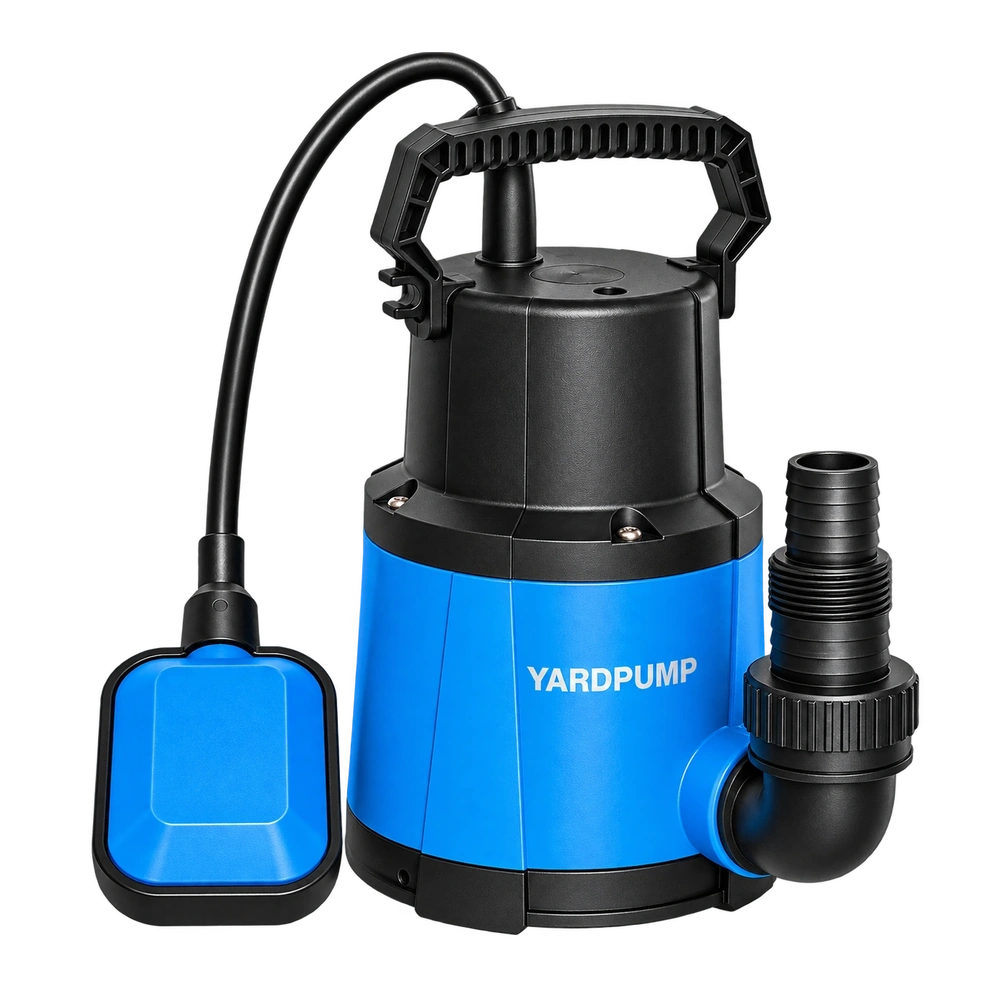
The short answer
For a safe, accessible clean-water discharge at a manageable flow rate, you can estimate the flow your installed pump is actually delivering by timing how long it takes to fill a container of known volume. Let the discharge stabilize, collect a fixed volume, time it, and divide volume by time. Repeat the measurement at least three times and record the hose arrangement, discharge elevation and water level.
The result describes the flow through that particular installation at that moment. It is not the pump’s maximum flow, a factory performance test or proof that a pump is defective if the number seems low.
Why a measurement is more useful than a guess
Picture a pump that is clearly running. Water comes out of the hose, yet the tank empties more slowly than expected. One person blames the pump rating, another buys a larger motor, and a third judges the flow by how forcefully the water splashes. None of those observations tells you how much water actually moved in a minute.
A narrow jet can look vigorous while carrying relatively little volume. A wider, slower stream may carry more. A timed volume gives you a starting point for a useful conversation: what is the flow now, and what changes when the installation changes?
First decide whether this test is safe
Use this method only where the liquid is clean or otherwise known to be non-hazardous, the discharge can be accessed safely, and the water can be collected without lifting or holding an unstable load. Do not attempt it in contaminated floodwater, sewage, chemical liquids, areas with submerged electrical equipment or any location where you would have to stand in water near energized equipment. Stop and obtain qualified assistance if the electrical condition is uncertain.
Install and protect the pump, supply and connections as required by its manual and local electrical rules, including appropriate ground-fault protection. Keep hands away from energized pump equipment and wet electrical connections. Do not hold a live discharge hose in your hand. Isolate power before moving the hose, removing debris or opening any part of the system.
Use a stable, marked container on a secure surface, with the timer kept dry. If the discharge fills a bucket in only a few seconds, or a full container would be unsafe to manage, use a fixed measuring tank, a suitable flow meter or a professional method instead.
A five-step field procedure
1. Keep the real discharge route
If you want to know the flow of the installed system, leave its hose inside diameter, length, bends, fittings, valves and discharge elevation as they are. Shortening the hose or lowering the outlet just to reach a bucket changes the hydraulic conditions. If any change is unavoidable, record it as a separate test condition rather than comparing the results as though nothing changed.
2. Check water level and steady operation
Make sure the pump is operating within the exact model’s permitted submergence, water-level and duty limits. Allow the discharge to settle into a steady stream. If a float switch stops the pump halfway through a collection, that run is not a steady-flow measurement. Never let the pump run dry, and never block the outlet to perform this test.
3. Time a known volume
Suppose you use the 20 L mark on a container. Keep the hose outlet above the collected water so the outlet does not become submerged and alter backpressure. Capture as much of the discharge as possible. Start timing as collection begins and stop when the water reaches the mark. A diversion device is acceptable only if its effect on the flow is understood; otherwise you have measured a different hydraulic arrangement.
4. Repeat at least three times
Empty or replace the container and repeat under the same conditions. If the times vary widely, investigate water-level changes, automatic cycling, splashing, a shifting hose, uncertain volume marks and inconsistent start/stop timing before averaging the numbers.
5. Write the conditions beside the result
Record the date, model and electrical version if known, liquid condition, hose diameter and length, discharge elevation, fittings, water-level change and all three times. A flow figure without its test conditions is difficult to compare or reproduce.
The calculation
Flow Q (L/min) = 60 × collected volume V (L) ÷ time t (s)
Flow Q (m³/h) = 3.6 × collected volume V (L) ÷ time t (s)
Example: a 20 L container fills in 24 seconds. The calculated flow is 3.6 × 20 ÷ 24 = 3.0 m³/h, or 50 L/min (about 13.2 US gpm). This is an arithmetic illustration, not a measured or rated value for any YARDPUMP model.
| Trial | Volume | Time | Calculated flow |
|---|---|---|---|
| 1 | 20 L | 24.0 s | 3.00 m³/h |
| 2 | 20 L | 23.6 s | 3.05 m³/h |
| 3 | 20 L | 24.4 s | 2.95 m³/h |
| Combined | 60 L | 72.0 s | 3.00 m³/h |
The combined estimate uses total volume divided by total time: 3.6 × 60 ÷ 72 = 3.00 m³/h. With unequal collected volumes, combining the totals is preferable to simply averaging the three individual flow rates.
How accurate is a bucket test?
A bucket marked “20 L” is not necessarily calibrated, and a person operating a stopwatch has reaction-time error. Suppose, for illustration, that the collected volume could be off by ±0.5 L and the time by ±0.5 s. For a nominal 20 L in 24 s, those assumed bounds produce a flow range of roughly 2.87–3.14 m³/h. This is an example of error sensitivity, not a claim about the accuracy of household buckets.
Other errors are harder to spot. Splashing outside the container makes the result too low. Submerging the hose outlet can change backpressure. A falling source-water level can change static head. Moving the outlet lower can increase flow even if the pump itself has not changed. Repeating a test reveals variation; it does not automatically remove systematic error.
If 20 L is collected in just two seconds, stopwatch error becomes a large fraction of the result. Use a larger fixed measuring vessel, a controlled diversion arrangement or a suitable meter rather than treating a tiny, rapid collection as precise.
A worked example: the same pump, 25% more measured flow
Consider a hypothetical clean-water installation. In its original condition, a 20 L container takes 30 seconds to fill: 2.4 m³/h. After isolating power, the operator finds a severe kink in the hose. With the kink removed and the hose length, outlet elevation and other conditions kept essentially the same, the next test takes 24 seconds: 3.0 m³/h.
That is an increase of 0.6 m³/h, or 25% relative to the first result. It shows why discharge-line resistance matters. It does not prove that every low-flow problem is a hose problem, and it says nothing by itself about the pump’s rated performance. Intake blockage, impeller damage, trapped air, electrical faults and inconsistent measurement conditions remain possible explanations in a real case.
Does the measured flow meet the job?
Start with the volume to be moved and the time available. If the task is to remove 1.2 m³ in 40 minutes, the simple average requirement is 1.8 m³/h. At a hypothetical measured constant flow of 3.0 m³/h, moving 1.2 m³ would take about 24 minutes—provided there is no incoming water and the pump can continue to operate to the target level.
Real installations rarely remain perfectly constant. Source-water level and system head can change, float controls may stop the pump, residual-water limits may prevent complete emptying, and rain may continue to enter. The 24-minute figure is an arithmetic scenario, not a completion guarantee. Critical drainage and continuously inflowing systems require a proper engineering assessment.
For procurement and engineering teams: make the result reproducible
| Record | Minimum useful detail |
|---|---|
| Pump / electrical | Exact model, power, voltage and frequency version; mark unknowns clearly |
| Liquid / level | Water condition, starting and ending level, any visible changes |
| Discharge route | Hose ID and length, elbows, valves, filters, submerged outlet? |
| Geometry | Height difference between source free surface and discharge outlet |
| Measurements | Container check, volumes, three times, splash or cycling observations |
| Comparison | The approved Q–H curve for the exact variant and its relevant duty point, if available |
A timed collection gives you an observation of Q, the flow. It does not by itself establish the total operating head H. Without that head, you cannot fairly judge compliance with a specific pump curve. Likewise, Qmax must not be compared directly with a field measurement taken through a hose and at a positive lift. Formal product-performance claims require appropriate test conditions and the curve for the exact model and electrical version.
Three things to remember
First, a forceful-looking stream is not a flow measurement. Second, a bucket test is a snapshot of one installation, not a substitute for a pump curve or durability test. Third, stop if there is any sign of electrical danger, contaminated water, dry running, abnormal noise or an equipment fault. No number is worth an unsafe test.