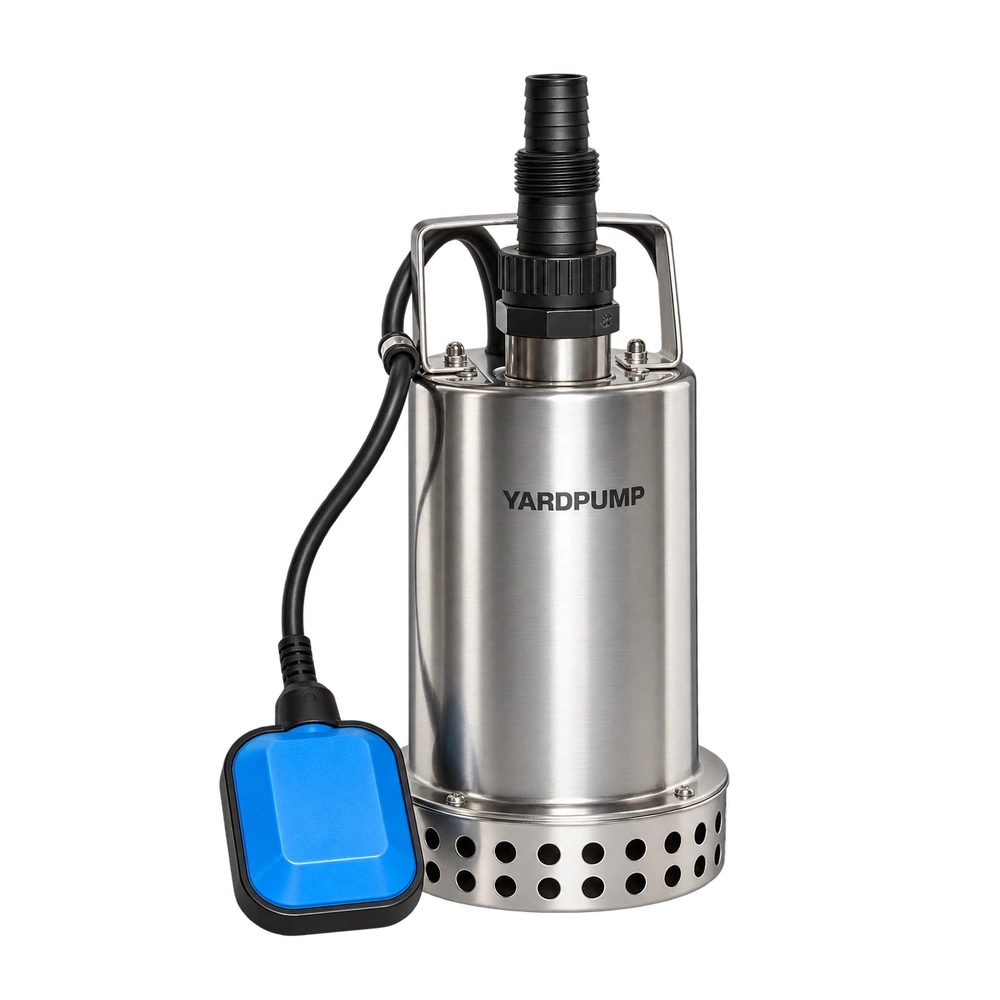
Imagine a supplier sends a smooth performance curve for a submersible pump. The order specifies a minimum flow at a given head, and that condition falls midway along the line. Was it actually measured on the bench? The picture cannot tell you. It may be suitable for screening a candidate, but purchasing acceptance must distinguish recorded readings, interpolation and extrapolation. Specify which duty has to be witnessed or tested directly.
A plotted line contains more values than a test records
A bench measures discrete operating conditions. A graph may join points, use a fitted curve, or combine model estimates with test data. Smoothing is not itself a problem. The distinction matters when a drawing does not identify measured points or describes values outside the test range as measured. Tests on different impellers, frequencies or liquid conditions cannot simply be joined into a single unqualified curve. A buyer should be able to identify the tested unit, revision and record behind each claimed point.
Choose a marked point and ask for its original flow and total head readings, point identifier and steady-state conditions. If the supplier sends a recalculated or smoothed table, ask how it relates to the original data. Total head also depends on the agreed definition and measurement arrangement, including pressure locations and elevation where relevant. Converting one outlet pressure does not by itself establish the reported head. Closely spaced markers on a graph do not necessarily mean equally frequent measurements.
Interpolation and acceptance serve different purposes
For illustration, suppose a tested pump develops 5.5 metres at 30 litres per minute and 4.5 metres at 50 litres per minute. Straight-line interpolation suggests about five metres at 40 litres per minute. That is an estimate between two observations, not a third measurement. If a contract requires at least 40 litres per minute at five metres, test around the required duty and assess the result under the agreed method. If the parties allow a result to be calculated from measured points, agree in advance on the method, interval and applicable tolerance. Do not choose a convenient fit after results arrive.
Predicting head at 70 litres per minute from the same two points is extrapolation. The pump curve need not stay linear over the entire range, and its operating limits may impose additional conditions. Extending the line to the end of the chart does not prove the pump can operate there.
Keep the graph, data and release decision connected
A quotation can show a curve marked with the revision, speed or frequency, liquid and plotting method. The acceptance record should list the required test points, original readings, units and instrument status. If production samples are involved, identify which pump was tested at which point and any configuration or condition changes. Keep revision links when a graph is updated so a presentation change does not obscure the original measurements. Where evidence is sparse, request a test at the important duty rather than a more polished curve.
This method applies to a controlled bench and the matching build. Installed delivery can change with water level, hoses or fittings. A clean-water curve also does not establish solids handling. A chart explains trends; traceable observations and a pre-agreed decision rule establish whether the order meets its duty.
Also ask whether a displayed point is a single observation, an average of repeated readings or a composite from several pumps. A smoother average does not establish the performance of an individual unit if the order applies its limit to each sample.
Frequently asked questions
May a quotation include interpolated values?
Yes, if clearly identified as estimates within the supported range. Do not present them as measured results or use them outside the agreed acceptance method.
Why ask for the table when the points are marked on the graph?
The table can identify actual measurements, sample identity and conditions that the picture does not show.
Is it enough if the pressure reading converts to the reported head?
No. Confirm pressure locations, elevation and the head definition, and link the reading to the same flow and test condition.