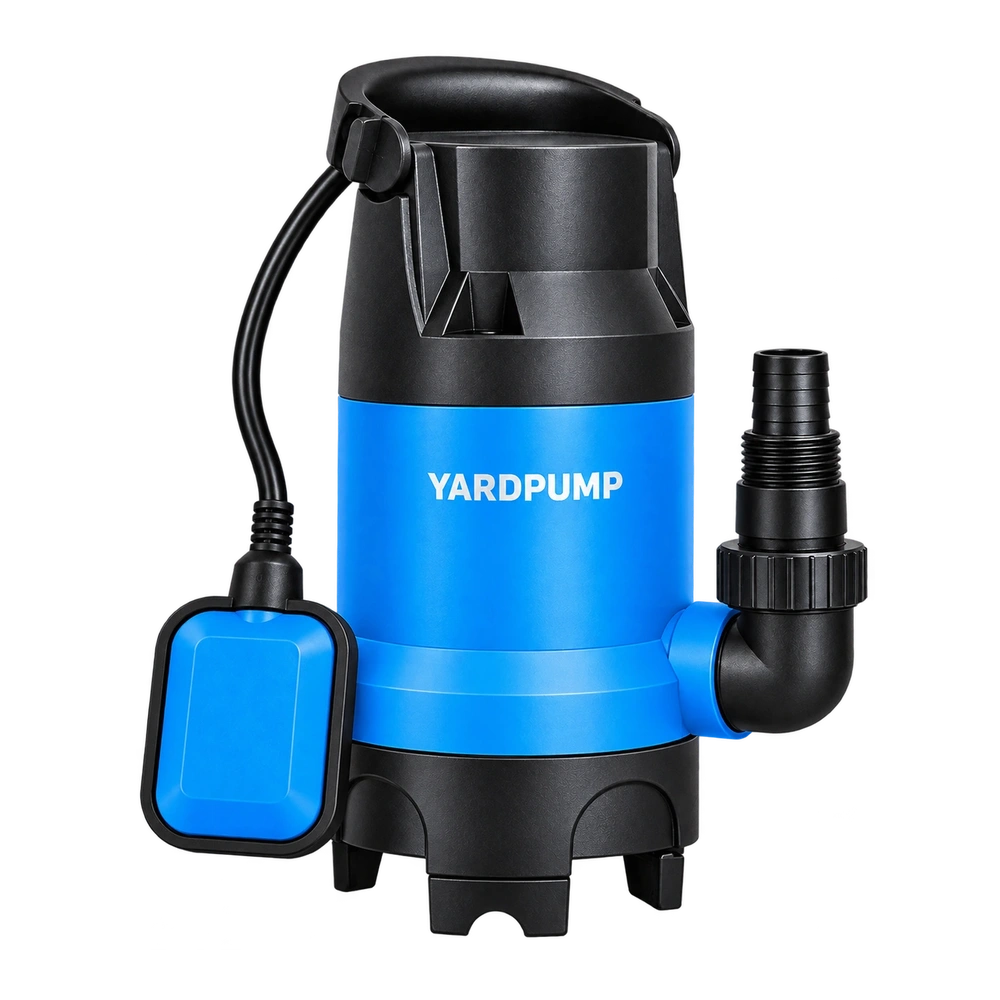
A flow display moves between two and six cubic metres per hour. Can a photograph of six be used as the pump's flow rating? First distinguish an instantaneous indication, a time average and accumulated volume. A peak screenshot does not establish a stable operating point. Decide whether the task is to understand a fluctuation, measure water moved during an interval or verify performance under specified conditions.
Three readings answer different questions
An instantaneous indication is the instrument's current output within its response characteristics. It is not an infinitely short, unfiltered physical measurement. A time average refers to an identified observation window. Totalised volume represents liquid passing the measurement boundary over the relevant interval.
Sampling, display refresh and damping settings can affect what the operator sees. Start by confirming units, range, measurement principle and installation conditions. Variation may reflect real flow changes, but it can also involve gas, an incompletely filled pipe, disturbance or signal quality. A fluctuating display does not by itself prove unstable pump performance. A smooth display does not prove accuracy either.
| Question | Useful evidence | Misleading shortcut |
|---|---|---|
| Is there a short-term fluctuation? | Timestamped trend and measurement status | Highest screenshot only |
| How much water moved? | Total volume over a defined interval | One reading multiplied by all elapsed time |
| What is the stable working point? | Measurements under specified stable conditions | Combining starts, stops and steady running |
| Are two tests comparable? | Common interval, duty and instrument settings | Comparing the largest numbers |
An average needs a time basis
Consider a hypothetical one-minute example. Flow remains at 2 m³/h for the first thirty seconds and 6 m³/h for the next thirty seconds. Because the intervals are equal, average flow is 4 m³/h and total volume is approximately 66.7 litres. The 6 m³/h value describes only part of the interval.
When intervals differ, simply averaging the two displayed numbers is incorrect. Weight confirmed readings by their durations, or reconcile totalised volume with the defined time interval. Calculation cannot make an unverified instrument trustworthy; it only processes the evidence supplied to it.
The denominator matters as well. An average over a complete minute containing a thirty-second stop is different from an average over running time only. Both can be useful, but they must be labelled accurately.
Investigate the variation before selecting data
Record pump state, water level, valve position, pipe condition and instrument settings. Check whether changes occur together. Automatic cycling or varying demand may mean the instrument is showing the actual system task. If the objective is a performance acceptance test, establish the conditions required by the approved method rather than choosing the most favourable period afterwards.
Check installation against the particular instrument's requirements. Flow direction, a full pipe and upstream or downstream arrangements may matter, but their details depend on the measurement principle and model. Do not apply one meter's straight-pipe requirement to every other type.
Where necessary, competent personnel can cross-check using a confirmed measurement method. Preserve original data and explanations of anomalies. Replacing an inconvenient trace with a smoother-looking screenshot removes evidence instead of resolving the uncertainty.
Write a report another person can reproduce
State the measurement purpose, units, observation interval, valid running time and total-volume basis. Explain whether start-up, shutdown or abnormal data were excluded and why. Removing low values without disclosure changes the result and can make a partial-period average appear to represent the whole task.
For a steady performance point, also record the other required operating conditions. Flow alone cannot describe whether two tests used the same duty. Purchasing parties should agree in advance whether they are comparing running flow or average water removal across an entire operating cycle.
This article addresses time definitions and evidence quality. It does not replace a complete pump performance test method or turn the example values into YARDPUMP specifications. Where instrument condition and operating state remain unconfirmed, retain that uncertainty rather than accepting a peak photograph as proof.
Frequently asked questions
Does increasing display damping improve accuracy?
Not necessarily. It may smooth the indication while leaving installation, calibration or genuine flow issues unresolved. It also changes response behaviour.
Must total volume divided by time match the displayed average?
Not always. The instrument may use another averaging window, update method or definition of valid time. Check its settings and terminology.
Does photographing maximum flow together with pressure prove the working point?
A single image cannot establish stability or complete conditions. Use the agreed measurement method and retain a reproducible operating record.